🔬 Methodology Explainer
Individual papers get retracted. Individual researchers get investigated. But what about the institutions that create the conditions for misconduct?
When a major scientific scandal breaks, the public focuses on the “rogue scientist.” But at ResearchFace, we ask a different question: What kind of institutional environment allowed that scientist to thrive?
The Research Integrity Risk Index (RI²), inspired by the framework proposed by Meho (2025), shifts the lens from individual actors to institutional environments. It acts as a structural smoke detector. We do not measure the quality of the science — we measure the metadata left behind by compromised publishing behaviours to determine whether a university’s internal compass is broken.
The Three Pillars of Vulnerability
To understand an institution’s risk profile, the RI² evaluates universities across three core, field-normalised metrics. Think of these as the three warning signs of a failing factory.
Pillar 1 — The D-Rate (Delisted Journal Exposure)
The Concept: Imagine a neighbourhood where the city has condemned the buildings because they are not safe. The D-Rate measures how many of a university’s researchers are still setting up shop in those condemned buildings.
The Metric: What percentage of an institution’s total publications appear in journals that have been forcibly delisted from major databases (such as Scopus or Web of Science) for severe quality concerns? A high D-Rate suggests a systemic tolerance for low-quality, “pay-to-publish” channels.
Pillar 2 — The R-Rate (Retraction Density)
The Concept: If a car manufacturer produces 1,000 cars and 50 have to be recalled for faulty brakes, that is a structural failure — not a coincidence. The R-Rate is the “recall rate” of a university’s research output.
The Metric: What is the ratio of formally retracted papers to the institution’s total output? The R-Rate reveals whether retractions are isolated incidents or structural patterns driven by extreme “publish-or-perish” pressures.
Pillar 3 — The S-Rate (Self-Citation Inflation)
The Concept: Imagine a restaurant that only gets five-star reviews from its own chefs. The S-Rate measures how much of a university’s perceived “global impact” is actually just its own staff patting themselves on the back.
The Metric: What proportion of an institution’s citation impact is generated internally through self-citation? Elevated S-Rates suggest metric gaming at the organisational level, often coordinated by departments to artificially boost their global ranking.
The Traffic-Light System: From Data to Action
Combined, these three metrics produce a composite RI² score. We do not use this score to rank universities from “best to worst.” Instead, we classify institutions into three actionable risk tiers based on a global baseline of the top 1,000 publishing universities:
-
🟢 Green (Low Risk)
The institution operates within the expected, natural variance of the global academic publishing ecosystem. Strong adherence to publishing integrity norms. -
🟡 Amber (Moderate Risk)
Emerging concerns. The institution shows moderately elevated risk in one or more pillars. Internal monitoring and governance review are highly recommended. -
🔴 Red (High Risk)
Extreme bibliometric anomalies indicating systemic integrity risk. This signals severe exposure to paper mills or coordinated metric gaming. External investigation warranted.
🌎 Country-Level Framework
RI² at the National Scale: A Country-Level Diagnostic
Unlike traditional rankings that celebrate volume or impact, the RI² focuses on Retraction Risk (R-Rate)—the proportion of a country’s scientific output that has been formally retracted from the scholarly record.
The institutional-level framework described above can be extended to the national scale. When we aggregate RI² data across entire countries, the map provides a visual “health check” of global science, using verifiable bibliometric data (retractions per 1,000 articles) to highlight where research-integrity systems are under the most pressure.
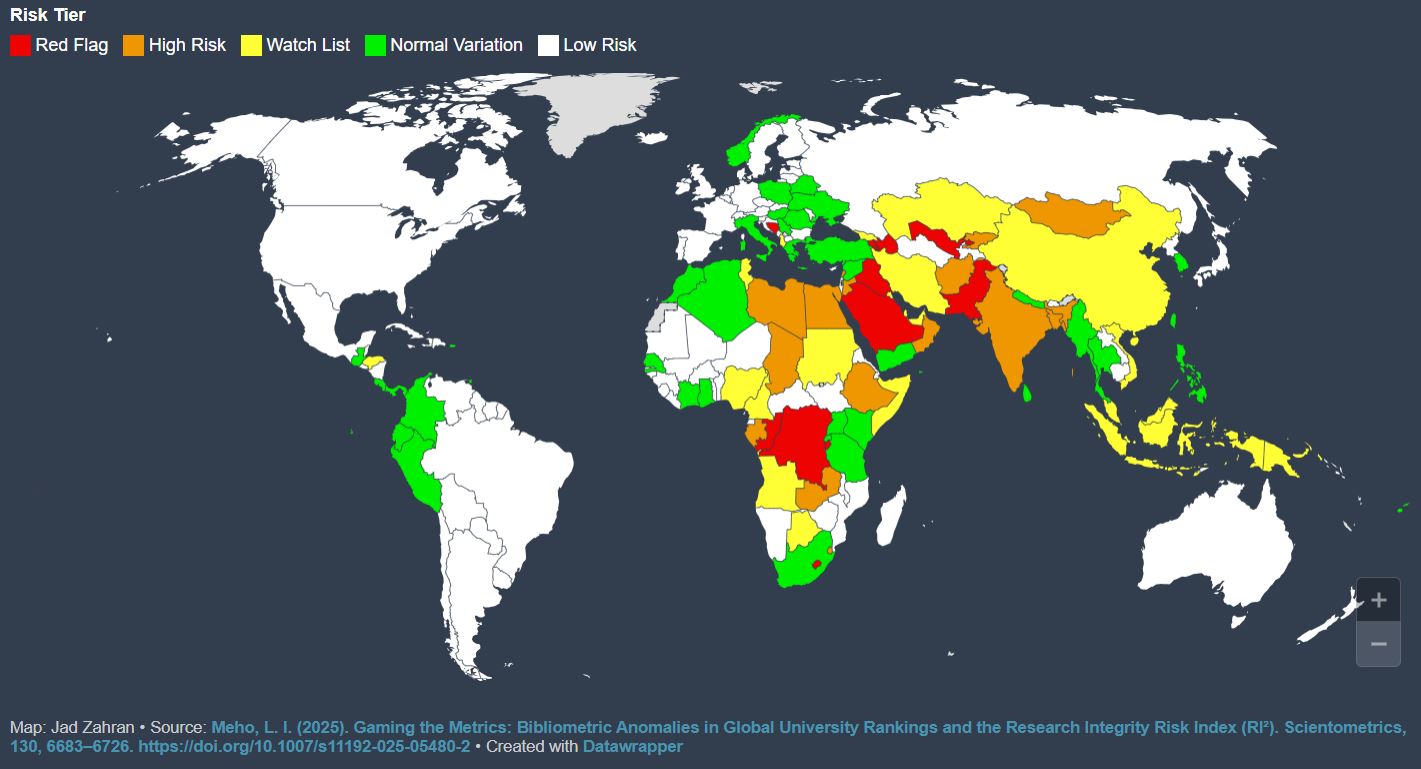
The Country Risk Map: Five-Tier Classification
The map uses a five-tier colour system to classify countries based on their structural exposure to integrity risks. These classifications are relative, comparing a country’s performance against the global baseline of the most-publishing nations.
🔴 Red — High Risk
Interpretation: Systemic Integrity Anomalies.
Countries marked red exhibit the highest rates of bibliometric volatility. This tier identifies “Critical Zones” where the frequency of retractions suggests that national oversight mechanisms, peer-review standards, or institutional pressures have reached a breaking point.
⚠️ Economic Link: This is the primary territory for Authorship-for-Sale schemes, where the price of a byline is highest due to extreme institutional pressure and where the bespoke fraud market is most active.
🟠 Orange — Risk (e.g., Egypt, Oman)
Interpretation: Significant Deviation.
The orange tier represents an elevated risk level. In these regions, institutional mandates for “high-impact” publishing often outpace the development of local research infrastructure. This gap creates a vulnerability where the quality-control process is significantly more strained than the global average.
⚠️ This is where the “Publish or Perish” culture has outpaced local oversight—and where Gulf-calibrated pricing tiers from broker networks find their most receptive buyers.
🟡 Yellow — Low Risk (e.g., China)
Interpretation: Stable / Low Comparative Exposure.
Yellow represents a relatively low-risk profile compared to the high-volatility zones. While these countries may have high publication volumes, their current R-Rate suggests a more balanced or monitored publishing environment, where the percentage of compromised literature remains low relative to their total output.
🟢 Green — OK (e.g., Yemen)
Interpretation: Normal Variation.
Green identifies countries where research output aligns with global norms of integrity. These regions typically show stable bibliometric patterns, with retraction rates that fall within expected variances, indicating a healthy and predictable research ecosystem.
⚪ White — OK / Minimal Data
Interpretation: Baseline Stability.
White regions represent areas where research integrity risks are minimal or where the volume of output is within a stable, low-variance range. These areas generally feature mature institutional accountability or do not face the extreme metric-driven pressures seen in higher-risk zones.
The Diagnostic Aim: Signals, Not Sanctions
The RI² Index is built on the principle that integrity risk is a structural issue, not an individual one.
- A Diagnostic Tool: The map is intended to support policymakers and research funding organisations in identifying where “quality-control gaps” are widening.
- Field-Normalised: The data accounts for differences in publishing cultures (e.g., Medical vs. STEM), ensuring that a country is not unfairly penalised for the specific disciplines it specialises in.
- Focus on Exposure: A “High Risk” classification is not an accusation of widespread misconduct; it is a signal that the country’s research record is more exposed to potential distortions, warranting stronger national safeguards and better institutional support.
📚 Primary Source
Meho, L. I. (2025). Gaming the metrics: Bibliometric anomalies in global university rankings and the Research Integrity Risk Index (RI²). Scientometrics, 130, 6683–6726. https://doi.org/10.1007/s11192-025-05480-2
Next in the Investigative Pipeline…
👥 “Custom-Baked Papers”
They hold real PhDs, publish under their own names in legitimate journals, and moonlight as ghost-authors for the bespoke fraud market. This profile-driven investigation examines the labour force behind custom-baked research—underemployed academics, freelance statisticians, and specialist editors who have turned scientific writing into a gig economy. The question is no longer who is buying. It is who is building.